How much water do you really need?
Almost everyone carries a number around — "two litres a day". But where does it actually come from? In this lesson we take hydration apart, calmly: what your body really regulates, why sodium is the actual key, and what's left of all the electrolyte marketing once you look closely.
This is the complete foundations version — it explains the whole system: from the physiology and the research through to the brand comparison. We take our time with the why, so you make the calls yourself afterwards.
The good news first: you don't need to count or keep an app. Once you understand what your body is actually doing, you make the right calls almost on your own. That's exactly where we're headed.
What "optimal" actually means
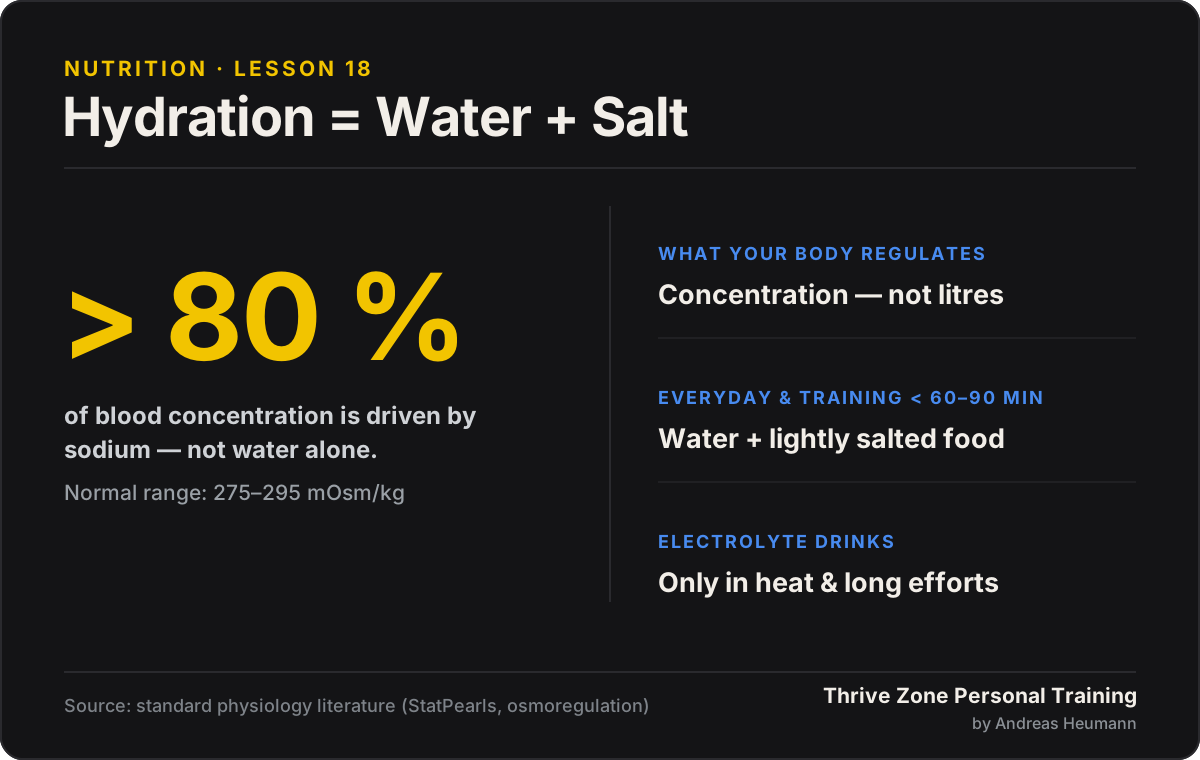
Before we talk amounts, it's worth looking at what your body even controls. And surprisingly, that isn't "litres". Your body regulates a concentration — namely how many dissolved particles are floating in your blood. Specialists call it plasma osmolality.
Picture an aquarium that wants to keep its salt level exactly constant. If the water gets too salty, it has to be diluted; if it gets too thin, salt goes in. Your body works the same way — only far more precisely. It holds osmolality in a narrow window of about 275–295 mOsmol/kg. Once the value climbs above roughly 300, that's an early signal of beginning dehydration.
And here comes the point that makes everything click: over 80% of this concentration comes from sodium and its accompanying ions. So sodium is the central control point — not water alone. That's why a blanket drinking amount says so little: it only describes one half of the equation.
Osmoregulation & plasma osmolality — standard physiology literature (e.g. StatPearls, "Physiology, Fluid and Electrolyte Balance"). Normal range ~275–295 mOsmol/kg.
Evidence type: textbook / physiology fundamentals
Your daily water balance
Your body runs a simple calculation around the clock: what comes in, what goes out. Once you know both sides, it becomes clear why a fixed litre figure can mislead.
| Intake (input) | Amount/day | Loss (output) | Amount/day |
|---|---|---|---|
| Drinks | ~1.5 L | Urine | 1.5–2.0 L |
| Water in food | 0.7–0.8 L | Skin + breathing | 0.8–0.9 L |
| Metabolic water* | 0.2–0.3 L | Stool | 0.1–0.2 L |
* Metabolic water is produced inside the body itself when it burns nutrients. It usually accounts for about 0.2–0.3 L a day. Intake and loss each come to roughly 2.4–3.1 L a day at rest.
Two things stand out. First: around a third of your water intake doesn't come from the glass at all, but from food and metabolism. Second: through skin and breath you lose fluid constantly — even when you aren't visibly sweating. That's the "insensible" loss, and it simply runs along in the background.
As a rough orientation, the US National Academies (NASEM) cite a total fluid intake — drinks plus food — of around 3.7 L/day for men and 2.7 L/day for women, valid for sedentary, healthy adults in a temperate climate. In practice, the simple rule of thumb of about 30 ml per kg of body weight works well. Important here: that's total fluid, not "this is how much you must drink" — a good portion comes through food.
These numbers shift with age and body composition. Muscle tissue binds more water than fat, and total body water drops from around 60% in young adults to about 45–50% in older age. For the 40–60 group that simply means: the same absolute loss weighs more in percentage terms — one more reason to take the topic seriously, but calmly.
National Academies of Sciences, Engineering, and Medicine (2005). Dietary Reference Intakes for Water, Potassium, Sodium, Chloride and Sulfate. (3.7 L ♂ / 2.7 L ♀ total fluid; ~20–30% from food.) nationalacademies.org
Evidence type: reference values / guideline
Office, flight, training — what really counts
Plenty of half-truths circulate about hydration, especially around flying. Let's look calmly at which factors really shift the balance — and which are smaller than often claimed.
Dry office air. Air conditioning dries the air, and you lose a little more water through breathing. But the effect is small: at rest, respiratory loss is roughly 15–20 ml per hour. Over a whole office day that adds up to maybe 0.1–0.2 litres extra — noticeable, but no litre deficit.
The long-haul flight. Aircraft cabins really are very dry: humidity is usually well under 20%, in cruise sometimes in single digits. The circulating "two litres of water loss per flight", however, isn't physiologically supported — it comes from marketing sources. The practically bigger effect on flights simply comes from drinking less, plus alcohol and long sitting. It isn't the breathing alone.
Training. This is where the real thing happens. Sweating costs you 0.5–1.0 litres per hour, in heat and at high intensity even more. It's by far the biggest variable item — and the only one that genuinely changes your strategy.
| Scenario | Extra loss | Classification |
|---|---|---|
| Air-conditioned office | ~0.1–0.2 L / 8 h | Real, but small |
| Long-haul flight | several small factors | Dryness documented, litre figures not |
| Moderate training | ~0.5–1.0 L / h | Directly relevant |
| Intense endurance in heat | up to ~2.0 L / h | Situational, rare in daily life |
Measuring your own sweat rate
Instead of guessing, you can determine your personal rate once yourself — no lab needed. Weigh yourself before training without clothes, train, weigh yourself again afterwards (towel off briefly, don't shower). The simple formula:
1 kg of weight loss corresponds to about 1 litre of sweat. Measured once under real conditions, you know your range — and never have to guess again.
National Research Council. The Airliner Cabin Environment and the Health of Passengers and Crew (cabin humidity low, single digits in cruise). ncbi.nlm.nih.gov
Maughan RJ, Shirreffs SM (2004). Exercise and fluid replacement. J Sports Sci, 22(1):39–55. DOI: 10.1080/0264041031000140577
Evidence type: report (NRC) · review (Maughan)
What dehydration really does
Why does all this matter at all? Because the first effects can set in before you feel thirsty — and because the scale matters, so you become neither careless nor anxious. Here are the thresholds and what they actually mean:
| Loss | What happens |
|---|---|
| 0–1% | All in the green. Thirst usually not yet triggered. |
| 1–2% | Aerobic performance drops measurably from ~2%, especially in heat. Hints of slight cognitive effects — small, and disputed in the research. |
| 2–3% | Heat regulation works harder, the pulse rises at the same load, head pressure and fatigue join in. |
| 3–5% | Clear performance drop, dizziness, concentration noticeably slips. |
| over 5% | Critical range — circulation and organ function are seriously challenged. Act immediately. |
This needs putting in context, because it's often overstated: that concentration collapses as early as 1–2% is not clearly proven. One meta-analysis found a small effect on attention and coordination from 2%, another — set up more strictly — found none that was significant. What remains is the practically important point: first effects can set in before the sensation of thirst. That's why it pays not to wait for thirst.
Wittbrodt MT, Millard-Stafford M (2018). Dehydration Impairs Cognitive Performance: A Meta-analysis. Med Sci Sports Exerc, 50(11):2360–2368. DOI: 10.1249/MSS.0000000000001682 (small effect from >2%)
Goodman SPJ et al. (2019) — counter-position: no significant effect under strict cross-over selection. Physiol Behav.
Evidence type: meta-analyses · evidence inconsistent
The delayed thirst — why it matters from 40
Here's a point that's especially relevant for this Academy's audience — and it has nothing to do with scaremongering, just physiology. With age, the thirst reflex becomes a little blunter.
Concretely that means: younger people feel thirst when osmolality reaches around 295 — still in the normal range, in good time. Older people often only at 300–305, i.e. once the slight deficit is already there. On top of that, the kidneys filter a little less finely over the years and total body water is lower anyway. Early signs — slightly darker urine, a faint head pressure, fatigue — are then quickly blamed on stress or coffee.
Review literature on the age-related blunting of the thirst reflex and the declining glomerular filtration rate in older adults (ageing physiology).
Evidence type: review literature
Hydration at the cellular level
Now it gets detailed for a moment — but it's worth it, because it explains why "just drink lots of water" can even backfire when you sweat heavily.
The basic principle is simple: water follows dissolved particles. Outside your cells, sodium is the dominant particle; inside the cells it's potassium. Both spaces hold the same concentration in balance. If you now drink only pure water after a high salt loss, the sodium concentration outside the cells falls. The balance tips, and water flows into the cells — they swell slightly. In the brain, that's exactly the problem.
Absorption in the gut, by the way, isn't a purely passive process. There's a small helper called the sodium-glucose cotransporter: when sodium and glucose arrive together, they're actively transported into the blood together, and water follows. That's the principle behind the oral rehydration solution used for diarrhoea or vomiting.
And here's the context that often goes missing in advertising: for the training context, this mechanism's added benefit is smaller than often sold. The ACSM considers the effect of added sodium on pure water absorption to be small, as long as enough salt from the meal is available. The cotransporter becomes genuinely central with illness and very long efforts — less so during your hour in the studio.
Hyponatremia: too much water, too little salt
From this follows a special case that endurance athletes in particular should know. During very long efforts — four hours and more — over-drinking pure water can dilute blood sodium so far that it becomes critical. Doctors call this exercise-associated hyponatremia.
In a well-known marathon study, around 13% of runners showed low sodium values. The striking part: the strongest predictor wasn't too little fluid, but too much — recognisable from weight gain during the race. For most of us it's rarely relevant, but the principle is important and easy to remember:
Almond CS et al. (2005). Hyponatremia among Runners in the Boston Marathon. NEJM, 352(15):1550–1556. DOI: 10.1056/NEJMoa043901
Hew-Butler T et al. (2015). Third International Exercise-Associated Hyponatremia Consensus Conference. Clin J Sport Med, 25(4):303–320. DOI: 10.1097/JSM.0000000000000221
Sawka MN et al. (2007). ACSM Position Stand: Exercise and Fluid Replacement. Med Sci Sports Exerc, 39(2):377–390. DOI: 10.1249/mss.0b013e31802ca597
Evidence type: observational study · guideline · position stand
Water from food
One of the most underrated hydration sources is sitting on your plate. Water-rich fruit and vegetables bring fluid with them — together with potassium, magnesium and fibre. Because the food slows gastric emptying, this fluid is available more evenly across the day. That's more sustainable than tipping back three big glasses at once.
| Food | Water | Potassium | Sodium |
|---|---|---|---|
| Cucumber | ~95% | 147 mg | 2 mg |
| Watermelon | ~92% | 112 mg | 1 mg |
| Spinach (cooked) | ~91% | 558 mg | 71 mg |
| Coconut water | ~95% | ~1540 mg/L | ~250 mg/L |
Values per 100 g, coconut water per litre. Source: USDA FoodData Central.
You spot the pattern immediately: plenty of potassium, but hardly any sodium. And that's exactly the catch. As valuable as water-rich foods are — they contribute an estimated 20–30% of your daily fluid — they practically don't replace the sodium lost through sweat. That takes salt, via the meal or salty snacks.
One more thing: the popular idea that "cell-bound" water from fruit is fundamentally better absorbed is only weakly supported. What can be shown clearly is something else — drinks with electrolytes and nutrients (such as milk or diluted juice) stay in the body longer than pure water. So the effect comes from the salt and accompanying substances, not from some mysterious water quality.
USDA FoodData Central. National Nutrient Database. fdc.nal.usda.gov
Evidence type: nutrient database
The evolutionary context
A fair question: humans functioned for thousands of years without electrolyte powders. How? The answer helps put the whole topic in perspective.
Traditional and indigenous cultures "ate" their water through water-rich plants and covered sodium via meat, organs, bone broth, fish and fermented foods. The body itself is optimised for salt scarcity: your kidneys hold sodium back very efficiently through a finely tuned hormone system (the renin-angiotensin-aldosterone system). Put simply — your body is a good salt-saver, because salt used to be scarce.
| Sodium intake | per day |
|---|---|
| Hunter-gatherers (estimated) | ~700–1200 mg |
| Active adult (sensible) | ~1200–2000 mg |
| Modern Western diet | 3500+ mg |
Important for context — and we say this openly: the values for the Stone Age diet are estimates, back-calculated from studies of present-day hunter-gatherer groups and palaeolithic models. They aren't measurement series. The decisive difference from today is, in any case, less the sweat rate than the activity pattern: back then episodic effort with long recovery phases, today regular, repeated training. The daily reach for the electrolyte drink is therefore more a consequence of modern training routines — not a biological constant.
Eaton SB et al. — estimated values for palaeolithic sodium intake (~690–768 mg/day) and data from present-day hunter-gatherer populations; RAAS sodium conservation (physiology textbook).
Evidence type: estimate / back-calculated · textbook (RAAS)
The electrolyte hype: Gatorade & co.
This brings us to the topic most myths cluster around. Let's start with the history, because it explains a lot. The scientific standard emerged in 1965 at the University of Florida: the team around Robert Cade analysed the composition of sweat and mixed from it a drink of water, sodium, potassium and carbohydrates — the basis of Gatorade.
The ACSM has confirmed this composition over decades: 500–700 mg sodium per litre, 4–8% carbohydrates, isotonic. In 60 years the basic formula has barely changed — because it works. What the premium wave has added since is, above all, more sodium and a higher price. The direct comparison, everything calculated per litre:
| Product | Sodium | Carbohydrates | Classification |
|---|---|---|---|
| Gatorade | ~450 mg/L | ~60 g/L (6%) | Since 1965, ACSM-validated. The benchmark. |
| DIY (recipe below) | ~600 mg/L | 4–8% | Hits the ACSM corridor precisely — for pennies. |
| Liquid IV | ~1060 mg/L | ~23 g/L | "Cellular Transport" = the familiar SGLT1/ORS mechanism, nothing new. |
| LMNT | 1000 mg/serving | 0 g | Very high sodium, sugar-free. For extreme endurance and "salty sweaters" — overdosed for normal training. |
| Coconut water | ~250 mg/L (variable) | ~5–9% | Lots of potassium, sodium below the optimum — but natural and additive-free. |
| Apple spritzer (1:1) | hardly any sodium | ~5% | A popular classic, delivers carbohydrates — but the decisive salt is almost entirely missing. |
Values calculated per litre; powder servings vary with dilution. Basis: manufacturer data (as of 2026) — Gatorade 160 mg Na / 355 ml · LMNT 1000 mg Na / serving · Liquid IV ~500 mg Na / 473 ml.
Sawka MN et al. (2007). ACSM Position Stand: Exercise and Fluid Replacement. Med Sci Sports Exerc, 39(2):377–390. DOI: 10.1249/mss.0b013e31802ca597 — sodium 0.5–0.7 g/L, carbs 4–8%
Product composition: manufacturer data Gatorade, LMNT, Liquid IV (nutrition labelling, as of 2026); coconut water: USDA. Origin: Cade et al., University of Florida, 1965.
Evidence type: guideline · manufacturer data · nutrient database
The hydration continuum
Now we bring it all together. The question "water or electrolytes?" has no yes/no answer — it depends on two quantities that multiply: duration × sweat rate. The longer and more intense, the sooner you need salt in your drink. This overview makes it visible:
| Duration ↓ / Sweat → | Low | Moderate | High | Extreme |
|---|---|---|---|---|
| 30–60 min | Water | Water | Optional | Recommended |
| 90 min | Water | Optional | Recommended | Essential |
| 120 min | Optional | Recommended | Essential | Essential |
| 3 hrs + | Recommended | Essential | Essential | Essential |
Assumption: continuous effort without food. Breaks (e.g. in tennis) lower the effective sweat rate. From around 3 hours, carbohydrate intake for energy supply comes into play.
Read the table like a map: top left — short and little sweat — water is enough. The further you wander down and to the right, the more important the salt becomes. For the vast majority of everyday and studio sessions, you stay comfortably in the green-to-yellow zone.
In practice
Enough theory — here's the synthesis you actually apply. Five simple decision rules cover almost everything:
- Everyday: around 30 ml/kg from all sources (food counts). Check urine colour, don't wait for thirst.
- Under 60 min: water by thirst. Eat normally afterwards. No electrolytes needed.
- 60–90 min moderate: water during. Afterwards a meal with some salt — that replaces everything lost.
- 90+ min or high sweat rate: during the session coconut water or salty snacks; afterwards a salty meal plus carbohydrates.
- Over 2 hrs: supply structurally — 300–500 mg sodium and 30–60 g carbohydrates per hour. Self-mix or standard drink. And: don't over-drink.
Self-mixed — hits the standard
The same profile as the validated ACSM standard, from real ingredients and without additives. Remember: the salt here isn't a flavour, it's the active mechanism.
| Recipe (per litre) | Ingredients | Sodium |
|---|---|---|
| Basic | 1 L water · 40–50 g honey · ¼ tsp sea salt · juice of 1–2 lemons | ~600 mg |
| Premium | 500 ml coconut water · 500 ml water · 30 g honey · ¼ tsp sea salt | ~850 mg |
| Fruity | 500 ml organic grape juice · 500 ml water · ¼ tsp sea salt | ~600 mg |
Cost around €0.25–0.50/L. All three sit within the validated ACSM corridor (500–700 mg Na/L, 4–8% carbs).
Limits & classification
To finish, the caveat that belongs with any serious synthesis. The underlying sweat and sodium data come mainly from studies with trained athletes and endurance settings. The mechanisms transfer to active adults with 2–4 hours of training per week — but the absolute losses for this group usually sit in the lower part of the ranges given. The "extreme" and "several hours" scenarios are mostly there for orientation.
Individual factors can shift the picture: genetics (some are "salty sweaters"), heat acclimatisation (up to 50% difference in sodium loss), medication and pre-existing conditions. Anyone with a sodium-relevant condition — such as high blood pressure or impaired kidney function — should please clear their salt intake with a doctor. The only truly personalised quantity remains your own measured sweat rate.
New lessons in your inbox every two weeks
New lessons with real sources, every two weeks. Sign up so the next one comes straight to you.
To the newsletterSources
Osmoregulation & plasma osmolality — standard physiology literature (StatPearls, "Physiology, Fluid & Electrolyte Balance"), normal range ~275–295 mOsmol/kg — textbook
National Academies of Sciences, Engineering, and Medicine (2005). Dietary Reference Intakes for Water, Potassium, Sodium, Chloride and Sulfate. nationalacademies.org — reference values
National Research Council. The Airliner Cabin Environment and the Health of Passengers and Crew. ncbi.nlm.nih.gov — report
Maughan RJ, Shirreffs SM (2004). Exercise and fluid replacement. J Sports Sci, 22(1):39–55. DOI: 10.1080/0264041031000140577 — review
Wittbrodt MT, Millard-Stafford M (2018). Dehydration Impairs Cognitive Performance: A Meta-analysis. Med Sci Sports Exerc, 50(11):2360–2368. DOI: 10.1249/MSS.0000000000001682 — meta-analysis (small effect)
Goodman SPJ et al. (2019). Physiol Behav — counter-position: no significant cognitive effect
Almond CS et al. (2005). Hyponatremia among Runners in the Boston Marathon. NEJM, 352(15):1550–1556. DOI: 10.1056/NEJMoa043901 — observational study
Hew-Butler T et al. (2015). Third International Exercise-Associated Hyponatremia Consensus Conference. Clin J Sport Med, 25(4):303–320. DOI: 10.1097/JSM.0000000000000221 — guideline
Sawka MN et al. (2007). ACSM Position Stand: Exercise and Fluid Replacement. Med Sci Sports Exerc, 39(2):377–390. DOI: 10.1249/mss.0b013e31802ca597 — position stand
Eaton SB et al. — estimated values for palaeolithic sodium intake; data from present-day hunter-gatherer populations — estimate / back-calculated
Product composition Gatorade, LMNT, Liquid IV — manufacturer data (nutrition labelling, as of 2026). Sports-drink origin: Cade et al., University of Florida, 1965
USDA FoodData Central. National Nutrient Database. fdc.nal.usda.gov — nutrient database